Translocations Season 1 Recap
Last season, Obedient Juvie (a.k.a. O.J.) and Curious Juvie (a.k.a. C.J.) helped me out with my first pilot study to test heat flux biologgers (what are these?) on freely swimming juvenile elephant seals. Not only did we learn what worked and what didn’t work in terms of sensor attachment and configuration, we also found out that translocations can take some unexpected plot turns, like having to drive 3 hours south to another elephant seal rookery to find C.J. and recover the instruments (read all about it here).
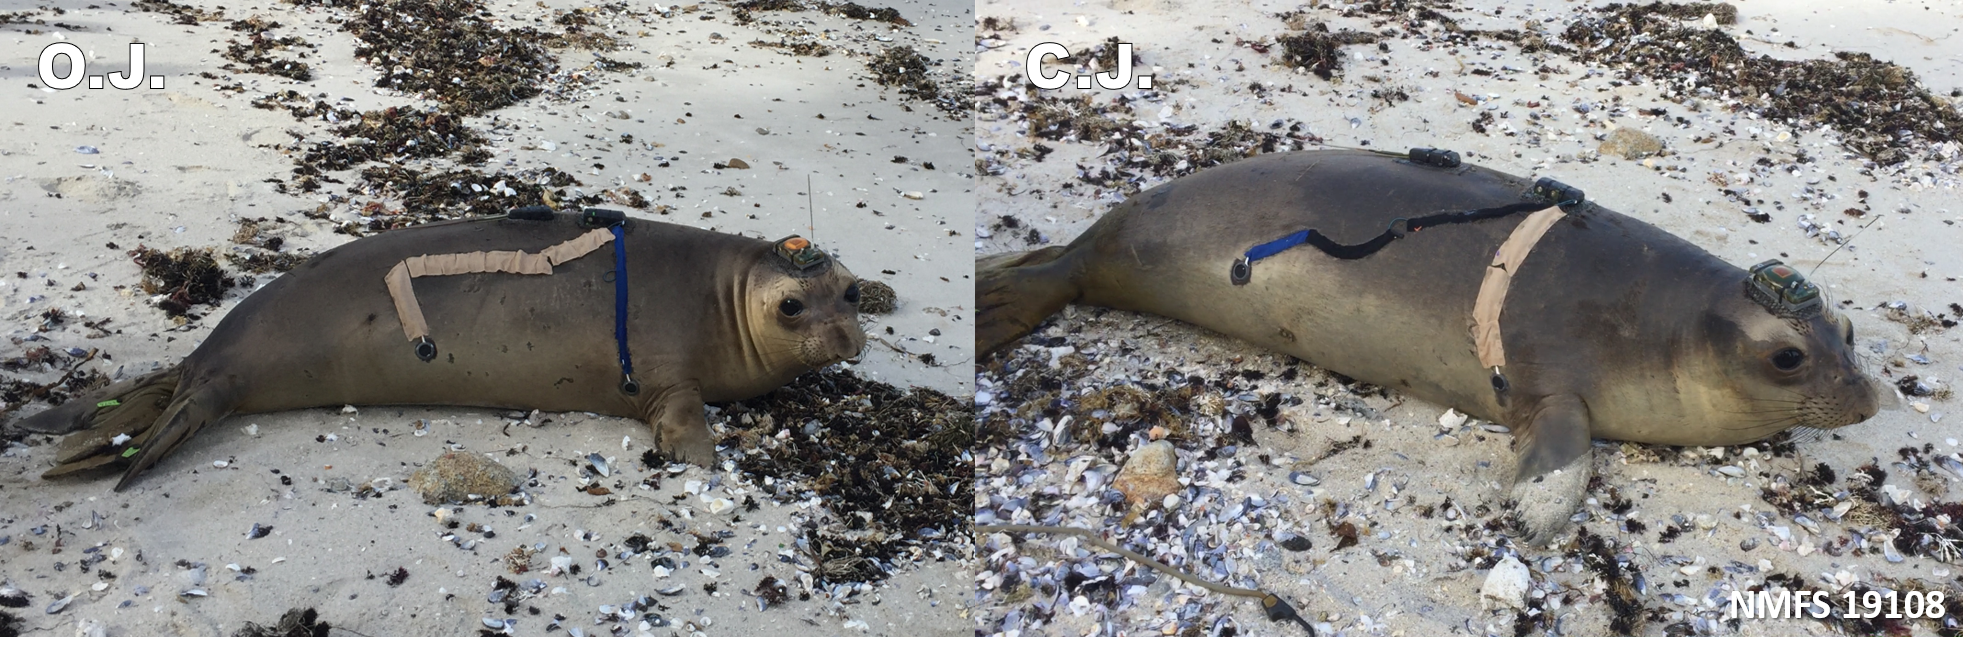
Pictures taken of O.J. and C.J. as they were released on a beach in Monterey. They were each equipped with a heat flux biologger, VHF transmitter, and a satellite tag on top of the head. The heat flux sensors adhered to the skin to record heat flux and skin surface temperature at two locations on the body. The cables that connect the sensors to the biologgers are glued to the hair with adhesive wrap and tape. Once they returned to land after their short journeys at sea, the tags were carefully removed to retrieve the data. (Translocation performed under NMFS permit #19108 and IACUC approval.)
Unlike O.J., none of the heat flux sensors were still attached when we found C.J., but much to my surprise, there was good data recorded on the tags!
The snapshot of the data below shows what I mean by ‘good’ data. The heat flux patterns from the two sensors were similar and seemed to vary based on dive behavior, which led me to believe the sensors remained attached for the entire 8-day trip out at sea until the juvenile got back on land. If the heat flux sensor had become detached during the trip, I would have expected to see a relatively flat line (with some noise) for the heat flux data. But there was no ‘flat line of doom’ when I downloaded and looked at the data on Instrument Helper (Wildlife Computers, Redmond, WA)—success!

A snapshot of about 1 hour of raw data collected by the tags that were on C.J. viewed in Instrument Helper (Wildlife Computers, Redmond, WA). The data includes: (1) dive profile (navy blue) (2) heat flux from the ax (light blue) and flank (lime green) sensors, (3) skin temperature from the ax (black) and flank (red) sensors (3) water temperature (light gray) (4) 3-axis accelerometer (only y-axis shown in dark green in figure). The lime green numbers on the y-axis of the plot is showing units in mV for heat flux.
Continue reading on 60° North Science Blog